
Hello.
KMDF (or WDF for that matter) being a Windows thing, you need to understand some Windows fundamentals.
In this iteration, Part 2, of “Writing Windows KMDF Drivers for Fun and Profit”, I’ll introduce you to important Windows Concepts such as Processes, Threads, Virtual Memory, System Services, Objects and Handles, Subsystems, and the Hyper-V Hypervisor. You’ll discover these constructs in great detail in this post. This post is informational and explorational in nature and can be treated as a reference, if you will.
With this, I wanted to focus on experimentation and a deep-dive explanation and do something different instead of replaying information that already exists. Output of various debugger commands are snipped indicated by a ... for the sake of brevity.
Anyone who’s ever dug a little deep about Windows might be familiar with this image:
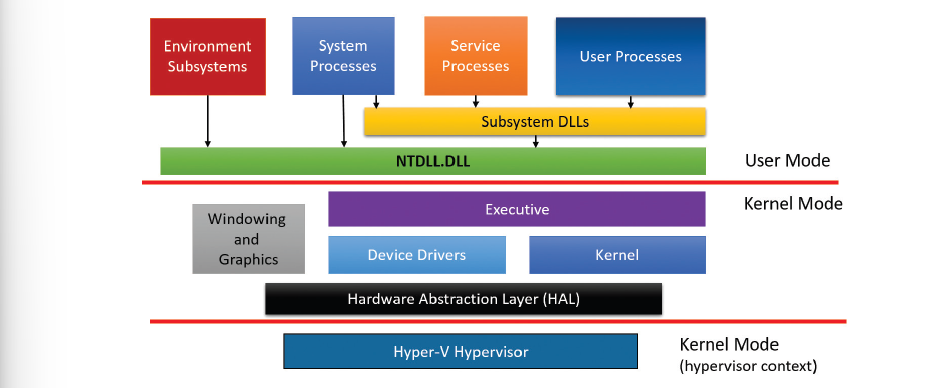
General Architecture, Source: Windows Internals, Part 1.
We’ll now examine this architecture in detail.
Processes
A process is a management and containment object which represents an instance of a program. Contrary to popular belief, processes don’t run, they “manage”. Each Windows process is defined by an executive process structure or nt!_EPROCESS. This structure (typedef struct _EPROCESS EPROCESS, *PEPROCESS to be exact) is the kernel’s representation of a process object. It exists only in kernel memory, user-mode can access indirectly through handles (handles are explained later). The Windows kernel maintains a nt!_EPROCESS structure for every process including -> System Idle Process (PID 0) and System (Process) (PID 4).
It is an opaque kernel structure defined as ->
| |
nt!_EPROCESS and its constituent data structures are contained in the System address space and can be examined from kernel mode, except for Process Control Block (PCB) which exists in User space.
Moreover, the subsystem service csrss.exe maintains a parallel data structure CSR_PROCESS. Additionally, the kernel mode part of the subsystem Win32k.sys maintains a per-process data structure, W32PROCESS. Except for the idle process, every process has a process object associated with it.
This post introduces you to the Kernel Debugger. It is a useful tool to examine internal components. To get started, you’ll need to ->
- Enable debugging. To do that, in an elevated command prompt, type
bcdedit /debug onand restart.- If secure boot is enabled, might need to do additional changes in the boot menu (You can avoid the hassle of tinkering with BIOS options. Instead, use a VM. Follow the above-mentioned steps, and you’ll be good to go).
- Install “WinDbg Preview” from Microsoft Store.
- After it’s installed, go to ‘Home’ -> ‘Attach to kernel’ -> Select ‘Local’. This will start a Local Kernel Debugging Session.
- Once there, you can type all the commands in
lkdin the command window.
To see all processes, use !process 0 0 in the Kernel Debugger. But the output would be huge. Instead, we’ll use !process with no arguments which will list information for the process owning the thread that is currently executing on CPU 0, or the current Debugging process.
| |
This returns the address of Process Environment Block (PEB) which is the user-mode representation of the process. It contains the information by image loader, heap manager, and other Windows components that need access to it from user mode. This corresponds to the image -> DbgX.Shell.exe (which is the current debug shell process). To examine its peb we need to switch the current context to that process, this can be done using .process /p with the process address, 0xffff9f016a6e4080 in this case. Then examine the peb using !peb with the address passed as a parameter, which is 0x293d469000. The complete command is -> .process /p ffff9f016a6e4080; !peb 293d469000.
| |
Many other drivers and system components, by registering process-creation notifications, can choose to create their own data structure to store information on a per-process basis. The executive functions PsSetCreateProcessNotifyRoutineEx and PsSetCreateProcessNotifyRoutineEx2 allow this and are documented in WDK. This technique might find its use in AV, EDR/XDR implementations.
You can see the contents of nt!_EPROCESS structure in lkd (Kernel Debugger). dt nt!_EPROCESS lists all fields of nt!_EPROCESS structure and their offsets in hexadecimal. Here’s what it looks like ->
| |
Usually, you’ll find
EPROCESSnotnt!_EPROCESSthat’s because in the kernel debugger, the latter is the symbol for the former, which is used for identification of functions, variables, and structures during debugging.
dt (display type) also shows specific contents of one or multiple fields by typing their names following the structure name. Like so ->
| |
In the output above, the command examines ProcessLock (_EX_PUSH_LOCK) field.
To see a list of kernel structures use dt nt!_*. Note that ntkrnlmp is the internal name of the 64-bit kernel.
| |
The last structure (in the snipped output above) is ntkrnlmp!_KINTERRUPT. This struct contains pointers to all Interrupt Service Routines (ISR) registered by the kernel. ISRs execute on the CPU whenever an Interrupt or Exception occurs. All ISRs are pointed to by something called an Interrupt Descriptor Table or IDT, which is a CPU-defined data structure. ISRs tell the CPU what code to execute when it encounters an interrupt.
You can view the contents of the IDT, including information on what trap handlers Windows has assigned to interrupts (including exceptions and IRQs), using the !idt command in lkd.
| |
Traps are a superset of Interrupts and Exceptions, a trap frame stores thread context and is a subset of the thread’s complete execution context. The kernel also treats system services as exceptions (although they are also technically system traps).
The IDT has 256 entries, each one of which points to an ISR. The interrupt vector is the index of a particular slot in the IDT. The nt!_KINTERRUPT structure represents a driver’s registration of an ISR for one of these vectors.
Use the -r flag to recursively examine all structures within nt!_KINTERRUPT, a number after -r determines the depth of recursion.
| |
Note the repeated occurrence of Flink (struct _LIST_ENTRY *Flink) and Blink (struct _LIST_ENTRY *Blink) fields. This makes sense as the kernel uses a circular doubly linked-list, called ActiveProcessLink for internal data structures. Each field is of the type LIST_ENTRY (typedef struct _LIST_ENTRY LIST_ENTRY, *PLIST_ENTRY). Flink points to the next node, while Blink points to the previous one.
All nt!_EPROCESS structures are similarly linked to form ActiveProcessLink with the ListHead stored in nt!PsActiveProcessHead. !process displays information from nt!_EPROCESS structure.
I noted that if recursion depth is increased to -r 4, it breaks the output ->
| |
The (probable!) cause might be that the memory indicated by ?? is uncommitted or de-allocated. As a process’ memory remains virtual unless VirtualAlloc allocates memory and zero-initializes it.
I encourage you to experiment with
lkdto become familiar with the syntax. Here is the resource you might need.
A process can be created using several WinAPI functions ->
CreateProcessA-> Most basic function which attempts to create a process and its primary thread with the same access token as the creating process. If a different token is required,CreateProcessAsUsercan be used.CreateProcessWithTokenW-> Part of theadvapi32.dll, it is similar toCreateProcessAsUserthe difference being the privileges required for the caller.CreateProcessWithLogonW-> A handy shortcut to log on with a given user’s credentials (user, domain, and password).
All of the above have different use cases but eventually, all execution paths lead to CreateProcessInternal which calls NtCreateUserProcess (part of) which makes the transition to kernel mode and continues the kernel mode part of the process creation with the same name. As the name suggests, NtCreateUserProcess creates a user process. A user cannot create a native process, such as smss.exe and csrss.exe, as CreateProcessInternal function will reject images with native subsystem image type.
Apart from NT Processes, the Kernel Executive supports additional processes, that are created bypassing WinAPI, such as Native processes, Minimal, or Pico Processes. These would be beyond the scope of this post.
You might be following along in a VM. If you are using VMware, you might notice performance slowdowns or hangs, which can get quite frustrating. There is a good way to get more performance!
- If you’re using VMWare Player, make sure the VM is “Shut Down” and not “Suspended”. Then, navigate to the Virtual Machine working directory. Locate the config file
.vmx. Open that in an editor and add the following line to it ->ulm.disableMitigations = "TRUE". This will disable side-channel mitigations applied to your VM.- If you’re using Workstation pro, then you can directly disable side-channel mitigations in “Edit Virtual Machine Settings”.
Threads
A thread is a subcomponent of a process that does the actual execution. A process contains threads (at a minimum, 1 thread). Threads have their address space isolated from each other and share a common address space of the process. At OS-level, a Windows thread is represented by an executive thread object. This object encapsulates nt!_ETHREAD (which is also an opaque kernel structure) which contains, among others, nt!_KTHREAD structure as its first member. nt!_KTHREAD points to several other structures all of which reside in system address space, with the exception of Thread Environment Block (TEB). TEB, like PEB, resides in userspace.
The Windows subsystem process (csrss) maintains a parallel data structure CSR_THREAD. For threads that have called a Windows subsystem USER or GDI function, the kernel-mode portion of the Windows Subsystem (Win32k.sys) maintains a per-thread data structure (W32THREAD) that the KTHREAD structure points to.
The simplest function to create a thread is CreateThread function which creates a thread in the current process. On successful completion, a non-zero handle is returned, and a unique thread ID if requested by the caller.
CreateRemoteThread is used to inject a thread into another process. It can be used by the debugger to force a break in a debugged process. The debugger injects the thread which immediately causes a breakpoint by calling the DebugBreak function. Another use can be to obtain information about a process when running within the target process context, this can be done for legitimate or malicious purposes.
Going back to lkd, you can use it to examine nt!_ETHREAD ->
| |
Listed above are the structures inside nt!_ETHREAD and their types. For instance, Tcb is of type _KTHREAD, and CreateTime is an instance of _LARGE_INTEGER structure.
!thread can be used to view information about a thread. But this can only be used in kernel-mode debugging.
| |
The 64-bit hexadecimal number after
THREADis the address ofETHREADblock.Two 16-bit hexadecimal numbers after
Cidare of the form processID.threadID, processID is 0x24cc and threadID is 0x0250 in this case.The 64-bit hexadecimal number after
Tebis the address of Thread Environment Block (TEB).The 64-bit hexadecimal number after
Win32Threadis the address of Win32Thread.
Apart from these, other fields show stack trace, priority, thread start address, owning process, and thread state.
Virtual Memory
It is what is written on the box, a memory that doesn’t exists (but is mapped). When a processor writes to a memory location it writes to a virtual address. The essence of virtual memory lies in the fact that from an execution perspective, the CPU doesn’t need to know whether the memory is mapped to RAM or Disk.
Below is the layout for two “extreme” cases: a 32-bit process on a 32-bit system (left) and a 64-bit process on a 64-bit system (right) ->
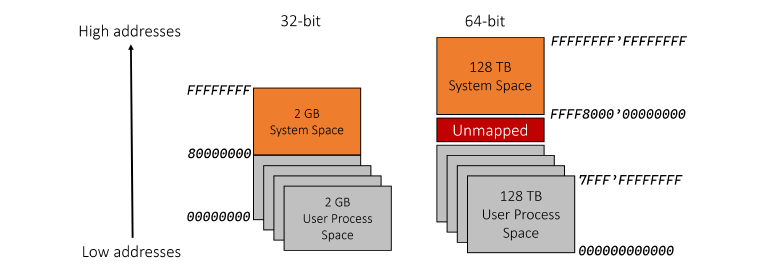
Virtual Memory Layout in Different Cases, Source: Windows Kernel Programming, 2nd Edition.
If the requested page doesn’t exist in RAM, the CPU raises a page fault exception, which causes the memory manager’s page fault exception handler to fetch data from the file (if it’s a valid page fault), copy it to RAM, update the page table entries and instruct CPU to try again.
Windows also supports large pages, by using Page Directory Entry (PDE) to directly map a large page without using a page table. This makes better use of Translation Lookaside Buffer (TLB) - a cache of recently translated pages maintained by the CPU.
A non-paged area is a memory region that is guaranteed to remain in memory as it’s never paged. But the Windows Bug Check error
PAGE_FAULT_IN_NONPAGED_AREA(0x00000050) seemingly contradicts this idea that a page fault cannot happen in a region where the referenced memory is guaranteed to be in RAM. Interesting! A probable cause for this might be a situation where a driver misuses non-paged pool allocations and/or references invalid memory. Bad driver code or corrupt system memory is the major reason almost all the time.
Mode of Execution
This refers to the nature of the code being executed. Does that belong to a user application or a part of a kernel component? The nature of code determines the privilege assigned to it. To support this structure, x64 processors are divided into privilege levels/rings -> Ring 3 to Ring 0. The purpose is to differentiate system and user data, and to protect it from inadvertent/malicious access or writes.
These rings go even deeper in modern Intel/AMD Processors ->
- Ring -1: Hypervisor
- Ring -2: System Management Mode (SMM)
- Ring -3: Intel Management Engine (ME). With a special emphasis, this sub-component is effectively dystopian. To understand why, I highly encourage you go to through the post -> Negative Rings in Intel Architecture: The Security Threats That You’ve Probably Never Heard Of on Medium by RealWorldCyberSecurity.
Below these exist the Microcode (which is a layer between CPU hardware and programmer visible ISA) and the actual Silicon.
When a user launches an application, Windows creates a private virtual address space and a private handle table (more on this later). Each page in Virtual Memory is tagged to indicate what access mode the processor must be in to read/or write the page. A user-mode application has its own private address space isolated from other processes and the OS. So, if a process crashes, it doesn’t affect other processes, they keep running.
A kernel mode component, such as a Kernel-Mode driver, shares its address space with the whole kernel. This implies if a component crashes it takes the whole system with it. The kernel, Hardware Abstraction Layer (HAL), and kernel drivers operate in kernel space.
System Services
Or System Calls are used to request kernel services like reading from the file, thread creation, etc. System calls in Windows follow a rather complex path as compared to Unix syscalls. Under Windows, user applications don’t call the native Windows OS services directly. Rather, they go through one or more subsystem Dynamic-Link Libraries (DLLs).
Take file creation for example.
When a user creates a new file in Notepad, its code calls CreateFile, which is documented, and implemented in kernel32.dll. This function runs in user mode, so there is no way it can open a file. After some error checking, it calls NtCreateFile, a function implemented in ntdll.dll. It is documented and is the one that makes the actual transition to kernel mode. Before the transition, it puts a number called System Service Number, into a CPU register (EAX on Intel/AMD architectures). Then it issues a special CPU instruction (syscallon on x64 or sysenter on x86) that makes the actual transition to kernel mode while jumping to a predefined routine called the System Service Dispatcher (SSD). The SSD, in turn, uses the value in the EAX register as an index into a System Service Dispatch Table (SSDT). Using this table, the code jumps to the system service (call) itself. For the Notepad example, the SSDT entry would point to NtCreateFile, implemented by the kernel I/O manager.
This can be seen in action. Open Notepad.exe in ‘WinDbg Preview’. Upon attaching to the process, the debugger will hit a default breakpoint ->
| |
Set a breakpoint in NtCreateFile inside ntdll.dll using bp ntdll!ntcreatefile. Then type g (go) to continue execution. The newly set breakpoint will hit almost immediately.
| |
Enter u (unassembled) command to see a few instructions ahead ->
| |
As mentioned above, EAX is set with SSN -> 0x55. This is the system call number. Then notice the syscall instruction. This switches the processor to kernel mode, jumping to the SSDT entry corresponding to the value inside EAX. Predictably, 0x55 corresponds to NtCreateFile. Notice the flag value set to 1 at offset 0x308 to SharedUserData. If this flag is set, the execution will take another path using the int 2Eh instruction on the second to last line of the output above. This flag corresponds to a specific Credential Guard VBS (Virtualization Based Security) feature as the hypervisor can better react to int instruction rather than syscall.
All right! Enough for this one!
Objects and Handles
In Windows, an object is a single, runtime instance of a statically defined object. They are kernel data structures representing commonly used facilities like files, registry keys, processes, threads, devices, etc. that are managed by the Object Manager, a component of the Windows Kernel. Not all objects have names, for eg., processes and threads don’t have names - they have IDs. That’s why the OpenProcess() and OpenThread() functions require a process/thread identifier (a number) rather than a string-base name.
Windows has three primary types of objects: Executive Objects, Kernel Objects, and GDI/User Objects.
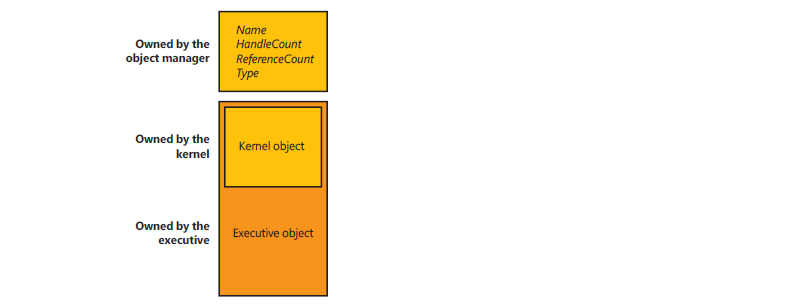
Object categorization, Source: Windows Internals, Part 1.
- Executive objects are implemented by various components of the executive (such as process manager, memory manager, and I/O subsystem).
- Kernel objects are a more primitive set of objects implemented by the Windows kernel. These objects are not visible to user-mode code but are created and used only within the executive.
- Majority of GDI/User objects belong to the Windows subsystem (Win32k.sys) and do not interact with the kernel.
WinObj tool from Sysinternals displays all objects in the system.
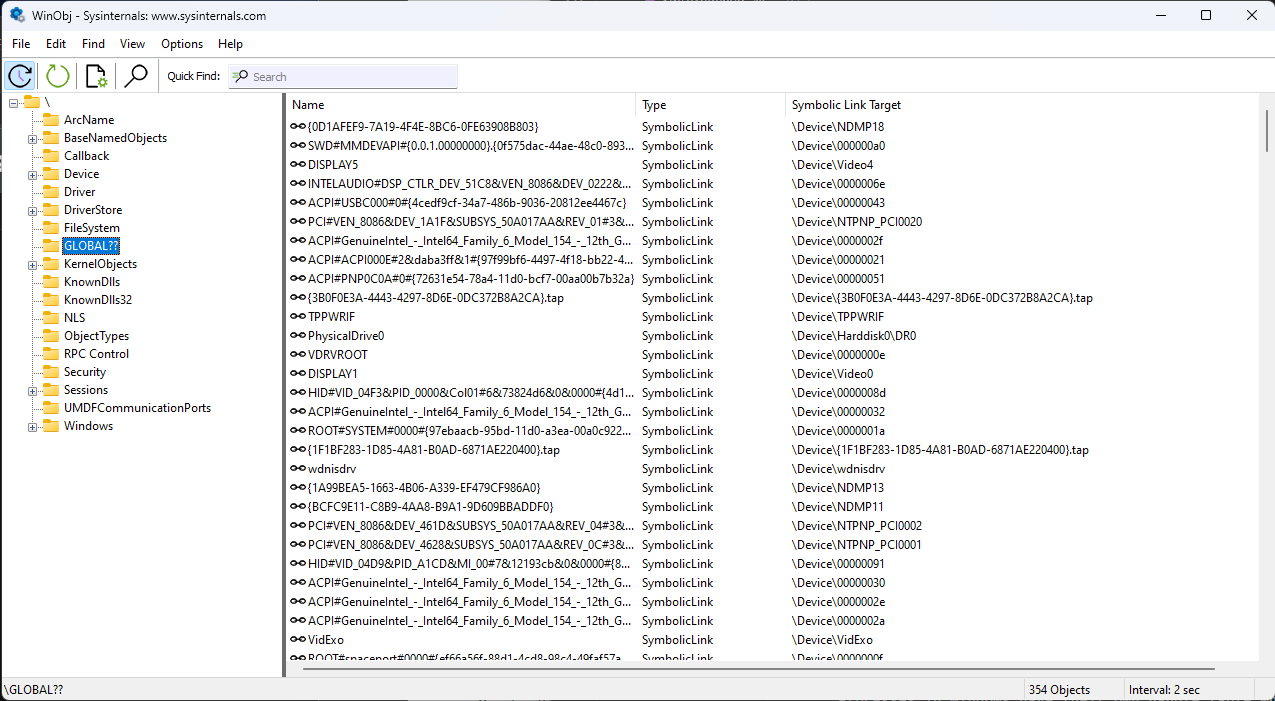
All GLOBAL$$ objects as viewed in WinObj.
All such objects are preceded by an nt!_OBJECT_HEADER structure that contains information about the object and is used to manage the life cycle of the object, allow it to be uniquely named, and secure it by applying access control, invoke the object type-specific methods and track the allocator’s quota usage.
Handles are references returned to the caller by the callee (APIs in this case) that are then translated to pointers by WDF. Processes in Windows have their own handle table which is stored in the kernel virtual address space. Handles are always a multiple of 4, and 0 is never a valid handle value.
The kernel (and driver) code can either work with a handle or pointer to an object. Handles can be converted to points using ObDereferenceObjectByHandle() and ObReferenceObjectByHandle() functions. The former function returns a pointer to the object and the latter function increments the reference count of the object. The reference count is decremented when the object is no longer needed. The object is freed when the reference count reaches 0. Object manager destroys the object if its reference count reaches 0.
nt!_HANDLE_TABLE_ENTRY represents an individual entry in the process handle table. Handle tables are allocated from Paged Pool. When a process terminates the function ExSweepHandleTable() closes all handles in the handle table of that process.
!handle can be used to examine the handle table of the currently running process. The output would be huge!
| |
The output displays the handle table of the current process and properties of individual handles, including a total of 758 entries. The HandleCount field shows 754 entries, but the OS allocates additional handles for improved performance, resulting in 758 entries in the table.
Subsystems, Subsystem DLLs and NTDLL
A subsystem is a facility by which Windows exposes some subset of the base Windows executive system services to application programs.
This means that some things that can be done from an application built on one subsystem can’t be done by another application built on another subsystem. Each executable image .exe is bound to only one subsystem. Subsystems are started by the Session Manager (Smss.exe) process. Subsystem startup information is stored under the registry key HKLM\SYSTEM\CurrentControlSet\Control\Session Manager\SubSystems
During process creation, the process creation code examines the sub-system type header code and notifies the target subsystem of the new process. This type of code is defined in the /SUBSYSTEM linker flag of Visual Studio Linker.
You can view the image subsystem type using the Dependency Walker (depends.exe). If you check notepad.exe ->
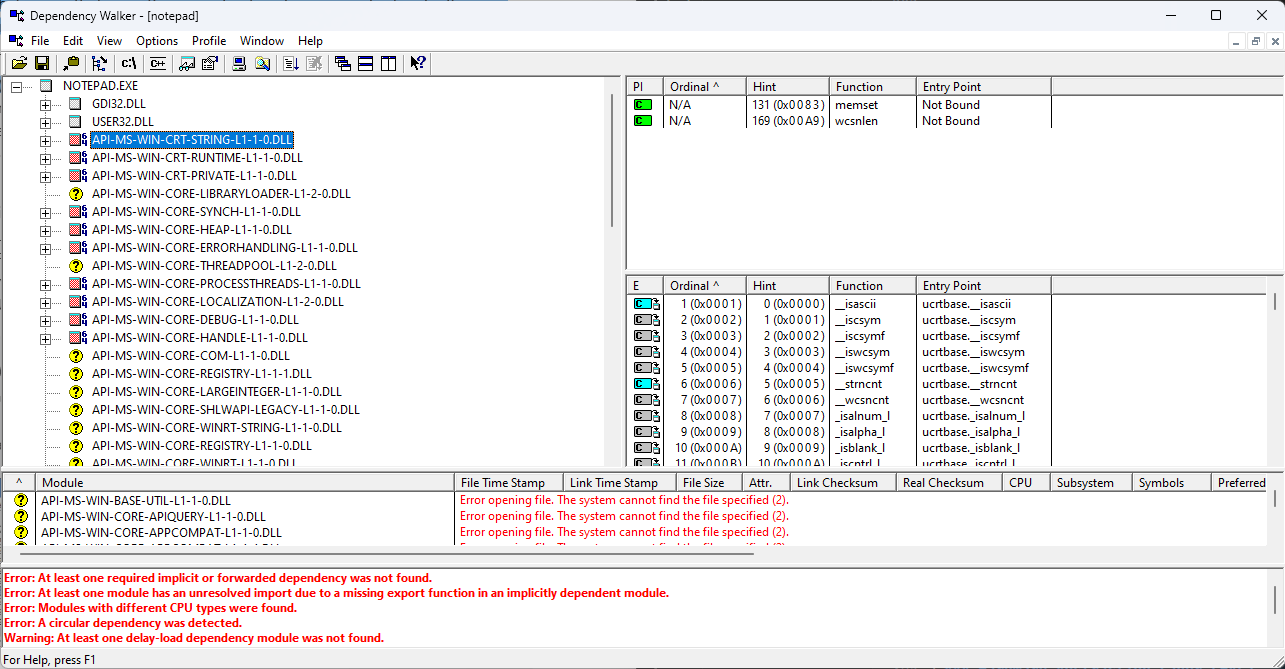
Dependency Listing of Notepad.exe in depends.exe.
The role of subsystem DLLs is to translate a documented function into the appropriate internal (and generally undocumented) native system service calls implemented mostly in NTDLL.DLL.
NTDLL.DLL comprises the lowest layer of code that still runs in user mode. It acts as a special support library primarily for the use of subsystem DLLs and native applications. Native images are those images that are not tied to any particular subsystem.
Hardware Abstraction Layer (HAL)
The HAL is a loadable kernel-mode module (Hal.dll) that provides the low-level interface to the hardware platform on which Windows is running. This is a layer of code that isolates the kernel, the device drivers, and the rest of the Windows Executive from platform-specific hardware differences.
It hides hardware-dependent details such as I/O interfaces, interrupt controllers, and multiprocessor communication mechanisms — any functions that are both architecture-specific and machine-dependent. So rather than access hardware directly, Windows internal components and user-written device drivers maintain portability by calling the HAL routines when they need platform-dependent information. For this reason, many HAL routines are documented in the WDK.
Hyper-V Hypervisor and Driver Code Security Challenges
This contains the hypervisor. There are no drivers or other modules in this environment. That being said, the hypervisor itself is composed of multiple internal layers and services, such as its own Memory Manager, Virtual Processor scheduler, Interrupt and Time management, Synchronization Routines, Partitions (VM instances) management, and Inter-Partition Communication (IPC), and more. This is one level below Ring 0 privilege, Ring -1.
One of the main roles of Hyper-V in Windows 10 and Windows Server 2016 (and later) is to enable support for Virtualization Based Security (VBS).
VBS provides an extra layer of security as the normal OS exists as a Hyper-V VM. Windows uses Virtual Trust Levels (VTLs), which use the hypervisor to configure virtual trust levels. This is to address challenges arising from malicious driver code which could access kernel-mode memory.
VBS provides extra security on top of processor isolation.
Conclusion and Credits
In this post, you learned about Windows Processes, Threads, System Services, and other specific topics like Virtual Memory, Objects, and Handles.
In the next post, you’ll start building your first driver. All the subsequent posts will lay more emphasis on the driver development process and would be code intensive.
Stay Tuned!
Tx0actical. Out.
This post draws inspiration from Windows Internals, if you wish to dive even deeper (The book, for instance, explains Session Manager,
smss.exein 38 points!), Windows Kernel Programming, the official Microsoft documentation and my experimentation. Also, if you wish to dive deeper into Windows Internals for security research, I would highly recommend CodeMachine, they provide training for all things “Windows Security”. Some of their articles have also inspired this post.